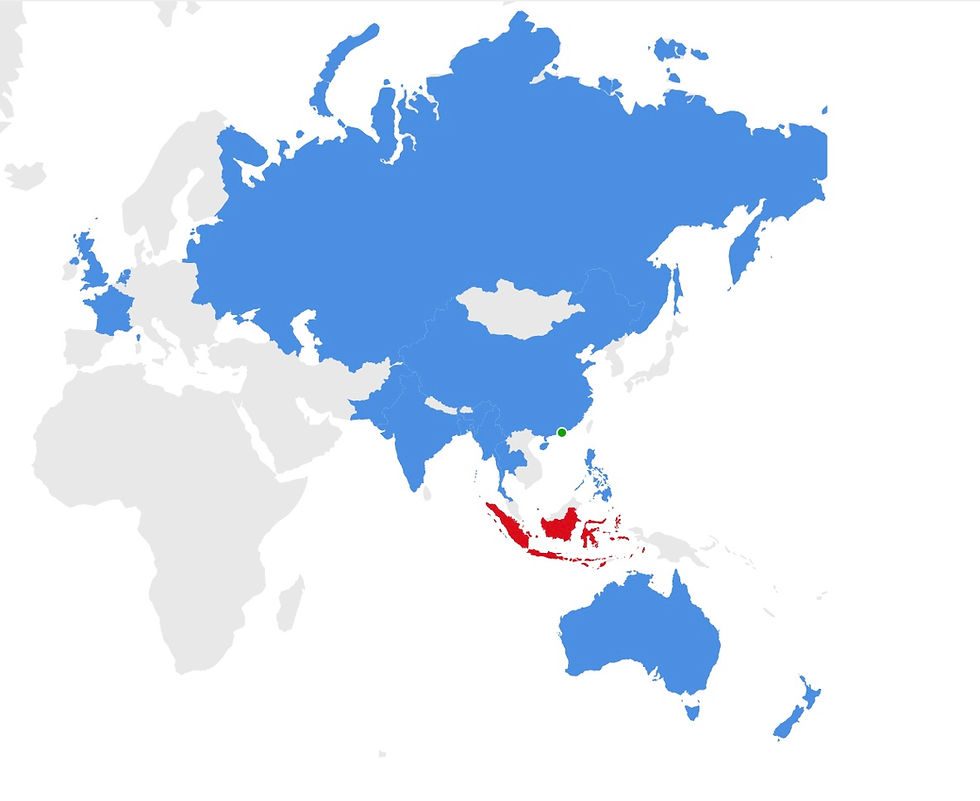
Growth of Expenditure within the UN System (1950-1975)
- ECOINT
- Sep 24, 2025
- 1 min read
Updated: Dec 21, 2025
A data visualisation by Sabine Selchow | 2025
Click on the image to open the interactive visualization
This visualization shows the regular budget development of various international organizations from 1950 to 1975. Users can select and deselect individual organizations using the checkboxes to create different comparisons. All regular budget values are in US $.
The data is taken from: Luard, Evan (1977) International Agencies: The Emerging Framework of Interdependence. London: Macmillan Press, p.3.
Open the viz: https://sabine-selchow.github.io/projects/un-budget/


